3 min read . March 3, 2023
Meteorologists use weather radar, which is short for weather surveillance radar, as an essential tool to monitor and predict weather patterns. By understanding how to read and interpret this valuable data source, you can become more knowledgeable about the weather conditions in your area and better prepared for any potential hazards. In this guide, we will explore the basics of decoding weather radar so that you can master the art of reading it like a pro.
To begin with, it’s important to understand what weather radar actually does. Essentially, it sends out radio waves that bounce off precipitation particles in the atmosphere (such as raindrops or snowflakes) and return to the radar antenna. The time it takes for these waves to travel back provides information on distance and location of precipitation, while changes in frequency give insight into its intensity.
Understanding Weather Radar
There are two main types of weather radars: reflectivity radars and Doppler radars. Reflectivity radars measure the amount of energy reflected back from precipitation particles; higher reflectivity values indicate heavier precipitation. Doppler radars analyze changes in frequency caused by movement towards or away from the radar to not only measure reflectivity but also detect motion within storms – this is known as Doppler shift.
Now that we have a basic understanding of how weather radar works let’s discuss some key terms you’ll encounter when interpreting data. Base Reflectivity refers to horizontal views at various elevation angles above ground level; Composite Reflectivity combines all available elevation angles into one image providing an overview of storm structure; Echo Tops show highest altitude where significant reflectivity values are detected – useful for identifying strong updrafts associated with severe thunderstorms.
Another important aspect when decoding weather radar is recognizing different types of precipitation based on their appearance on screen. Smooth areas with varying shades, typically indicate rain’s intensity; bright, circular spots often show up as hail, while fuzzy appearance and lower reflectivity values compared to rain can identify snow. Furthermore, you should watch for hook echoes – these curved shapes might indicate rotation within a storm and potential tornado development.
Lastly, it’s crucial to understand the limitations of weather radar. While it provides valuable information on precipitation location, intensity, and movement, it cannot detect smaller particles such as fog or clouds. Furthermore, radar beams travel in a straight line while Earth’s surface curves. Higher elevation angles will provide less accurate data at greater distances from the radar site. Keep these factors in mind when interpreting weather radar data to ensure you have a comprehensive understanding of current conditions.
Interpreting Colors and Patterns
Now that we’ve covered the basics of decoding weather radar let’s dive into interpreting colors and patterns on screen. Weather radars use color scales to represent different levels of reflectivity or precipitation intensity. Typically, green indicates light precipitation, yellow represents moderate rainfall or mixed precipitation. On the other hand, red signifies heavy rain or hail, while purple denotes extremely heavy rainfall or large hailstones.
When examining weather radar images, pay close attention to areas with rapidly changing colors. This could signify an intensifying storm system with increasing precipitation rates. Additionally, look for patterns such as lines (indicating squall lines), clusters (suggesting multicell thunderstorms), or isolated cells (representing single-cell storms). Each pattern has unique characteristics that can help predict future storm behavior.
Another important aspect when interpreting colors and patterns is understanding velocity data provided by Doppler radars. The color scale displays this information, ranging from blue to green/yellow. Red/orange indicates motion towards the radar. By analyzing velocity data alongside reflectivity images, you can gain insight into wind speeds within storms. This may indicate potential hazards such as damaging winds or tornadoes.
In addition to colors and patterns, it’s essential to consider the time stamps on weather radar images. Weather conditions can change rapidly, so always ensure you’re viewing the most recent data available. Furthermore, take note of any trends in storm movement or development over time. This can help you anticipate future changes in weather conditions.
Finally, remember that practice makes perfect when it comes to mastering the art of reading weather radar like a pro. The more familiar you become with interpreting colors and patterns on screen. You’ll be better equipped to understand current conditions and make informed decisions about potential hazards.
Become a Pro Forecaster with UV Weather’s Radar Mastery
Upgrade your weather forecasting skills with UV Weather! This browser extension uses AI to provide up-to-date weather updates and forecasts in a news-style format. It’s easy to use and featured by Google. Stay informed about weather conditions and potential hazards with ease. Install UV Weather now and become a pro at decoding weather radar data!
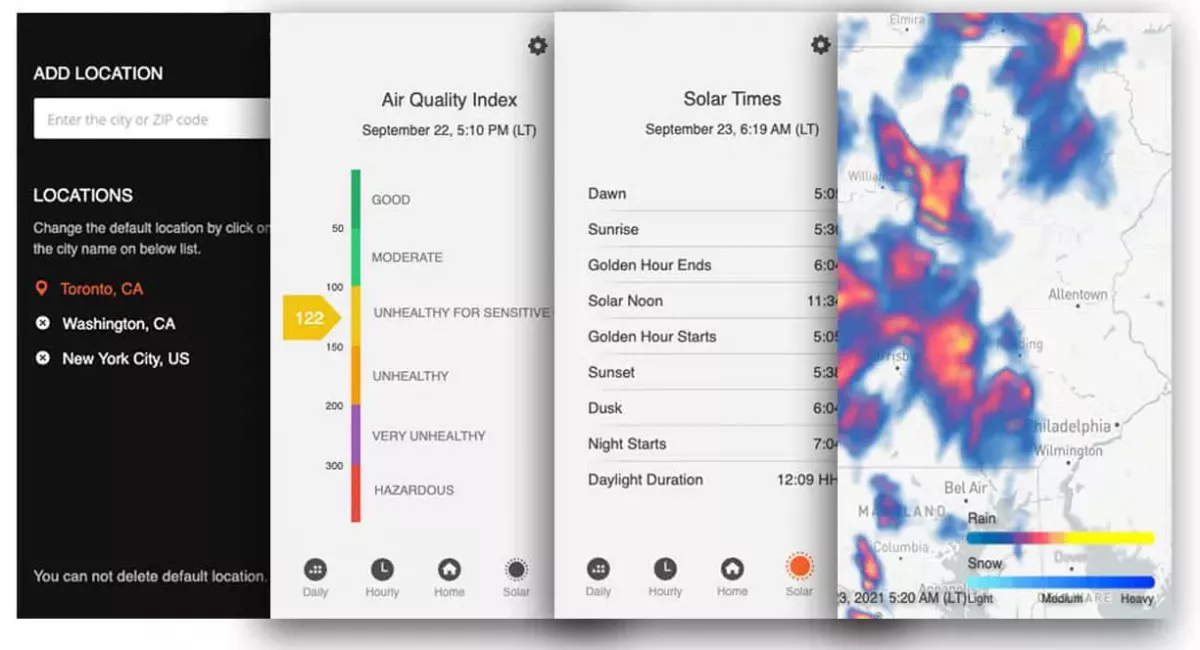
UV Weather | Animated Radar Map